Google’s BERT update is going to impact your long tail SEO queries. Time to measure benchmark your long tail traffic, to help measure if you’ve been BERT-slapped.
[toc class=”alignright”]Table of Contents
- Why benchmark long tail
- Long vs. long tail
- How to benchmark long tail
- Export GSC queries
- Find query length
- Match to GA
- Now what?
BERT helps Google’s algorithm better understand the nuances and context of words in search queries.
The deeper understanding means better matching for those queries with more relevant results and featured snippets.
“Better matching” means a change in rank distribution.
Let’s dive in.
Google claims that BERT will impact 10% of queries. Some SEOs are skeptical of that number, but that’s what Google says.
The type of queries likely to be affected are queries are long tail queries.
Let’s look at some of the examples Google and other have provided.
- 2019 Brazil traveler to USA need a visa
- Do estheticians stand a lot at work
- Can you get medicine for someone pharmacy
- Parking on a hill with no curb
- How to dress up blue jeans
Notice anything? Look how long these phrases are.

Here’s what Google says (emphasis mine)…
Particularly for longer, more conversational queries, or searches where prepositions like “for” and “to” matter a lot to the meaning, Search will be able to understand the context of the words in your query. You can search in a way that feels natural for you.
Now that we know that BERT is likely to effect long tail queries, it’s time to document your long tail queries and traffic, so we measure their performance and acquisition over time.
Quick note on long vs. long tail
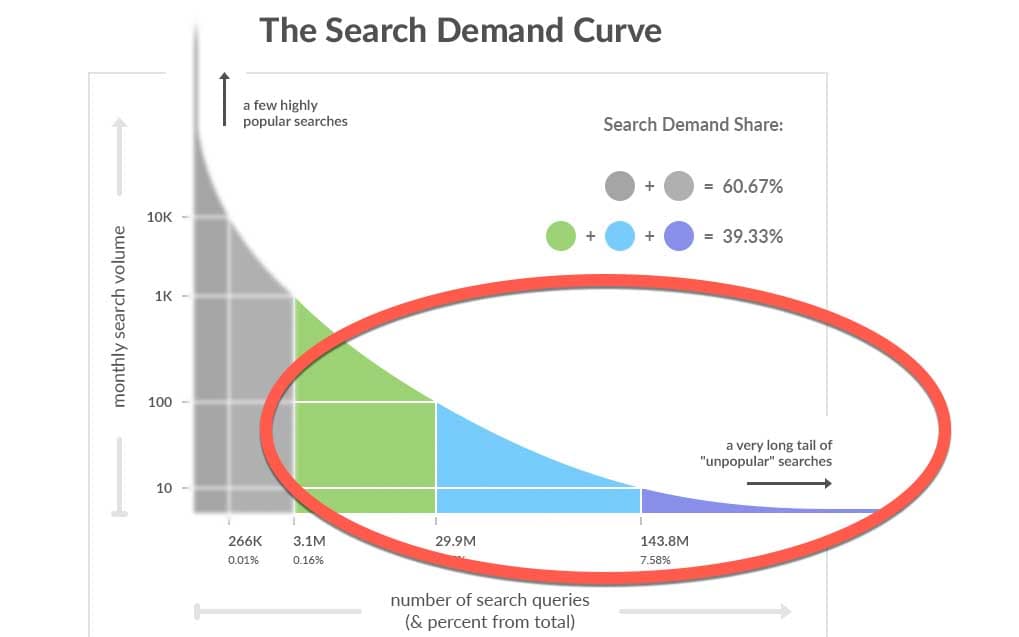
Longtail SEO and long tail queries actually refer to the number of searches a query receives—not the length of the query itself.
But the correlation between long queries and low search volume is extremely high.
That means that the longer a query is—more words provided in the search—the more likely that phrase is to fall into the “long tail” category.
Thus, I’m using query length as a proxy for long tail keywords.
Don’t @ me.
Now that we established that long tail queries are likely to be hardest hit by Google’s BERT update, let’s get to work benchmarking your long tail queries and traffic.
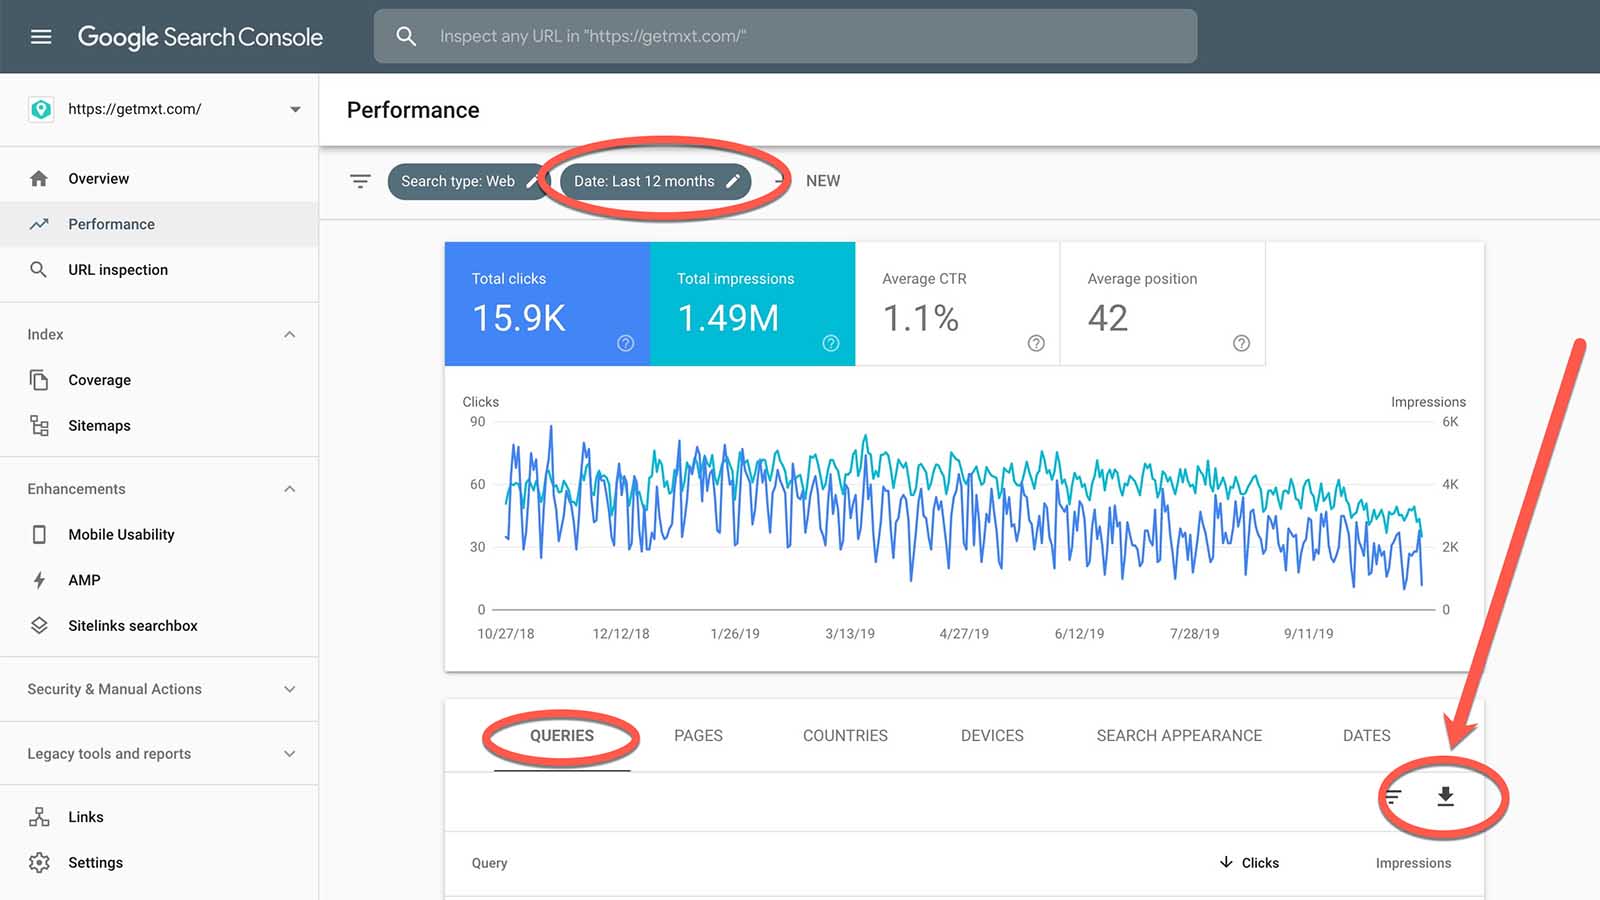
1. Export GSC queries
First, export all query data from your Google Search Console account. I suggest exporting at least a year of data, probably more.
The first time I did this, I started with 2.5 years— way more than you’d need in a typical digital marketing report, but a good base of data to work with.
There’s a limit to how much data is useful, especially if you’ve had big changes in organic traffic or visibility, but still— get a good amount of data to work with.
2. Find & sort query length
This one is the real money-maker. Once you have your Google Sheet, it’s time to count and sort.
You’ll need this formula in Google Sheets.
=(len(A2)-len(SUBSTITUTE(A2," ",""))+1)
I’m sure Excel has something similar but Excel is terrible and no one should use it.
So there.
Long tail ≠ long, but we want length anyway
As noted above, “long” and long tail are different. But they’re closely related.
With length as a proxy, I want to find the word count of each of my queries.
The fastest way to do that in Google Sheets is to count the spaces in between words.
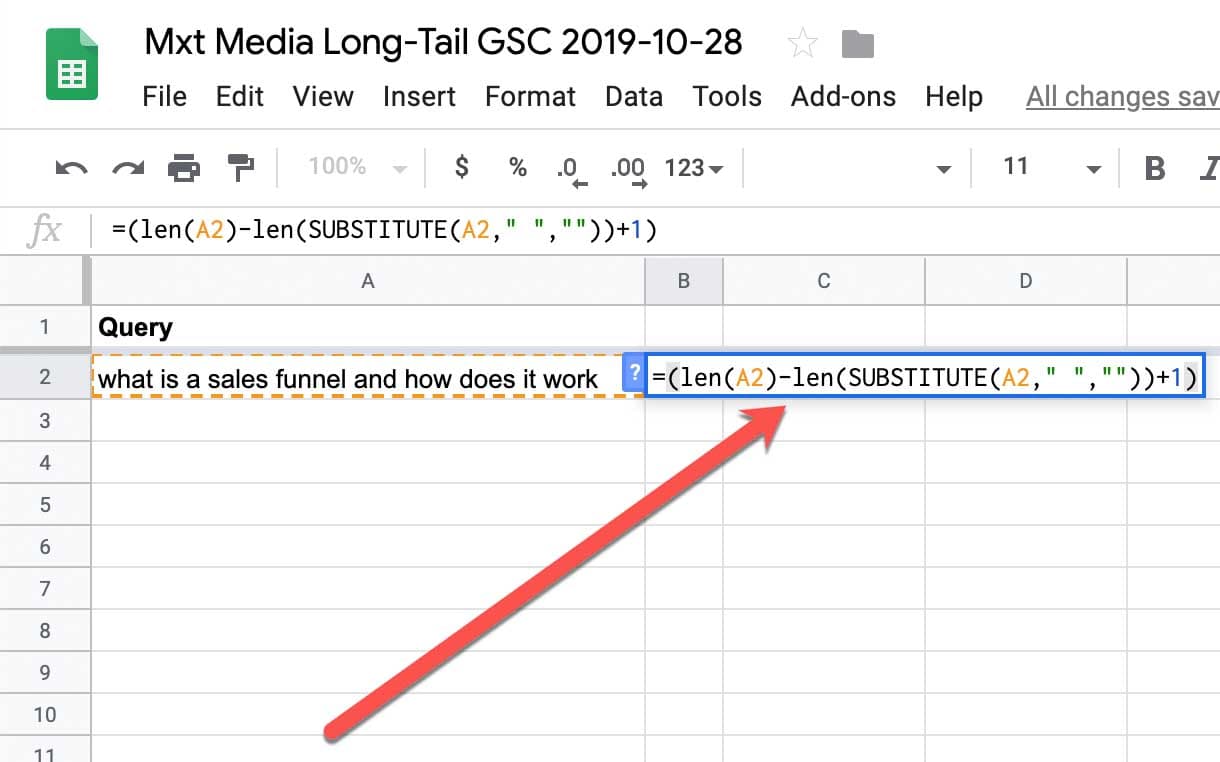
Formula to count words per cell
In spreadsheet speak, this formula says…
((full character count) – (character count with all spaces removed) = number of spaces) + 1 to account for the last word
That gives us the number of words in each cell.
Here’s the formula again:
=(len(A2)-len(SUBSTITUTE(A2," ",""))+1)
Make a new column in your spreadsheet, and paste that formula into each cell.
Make sure A2 corresponds to A2. A3 to A3, etc. Google Sheets should do that for you automatically, but if you get it wrong it will break everything.
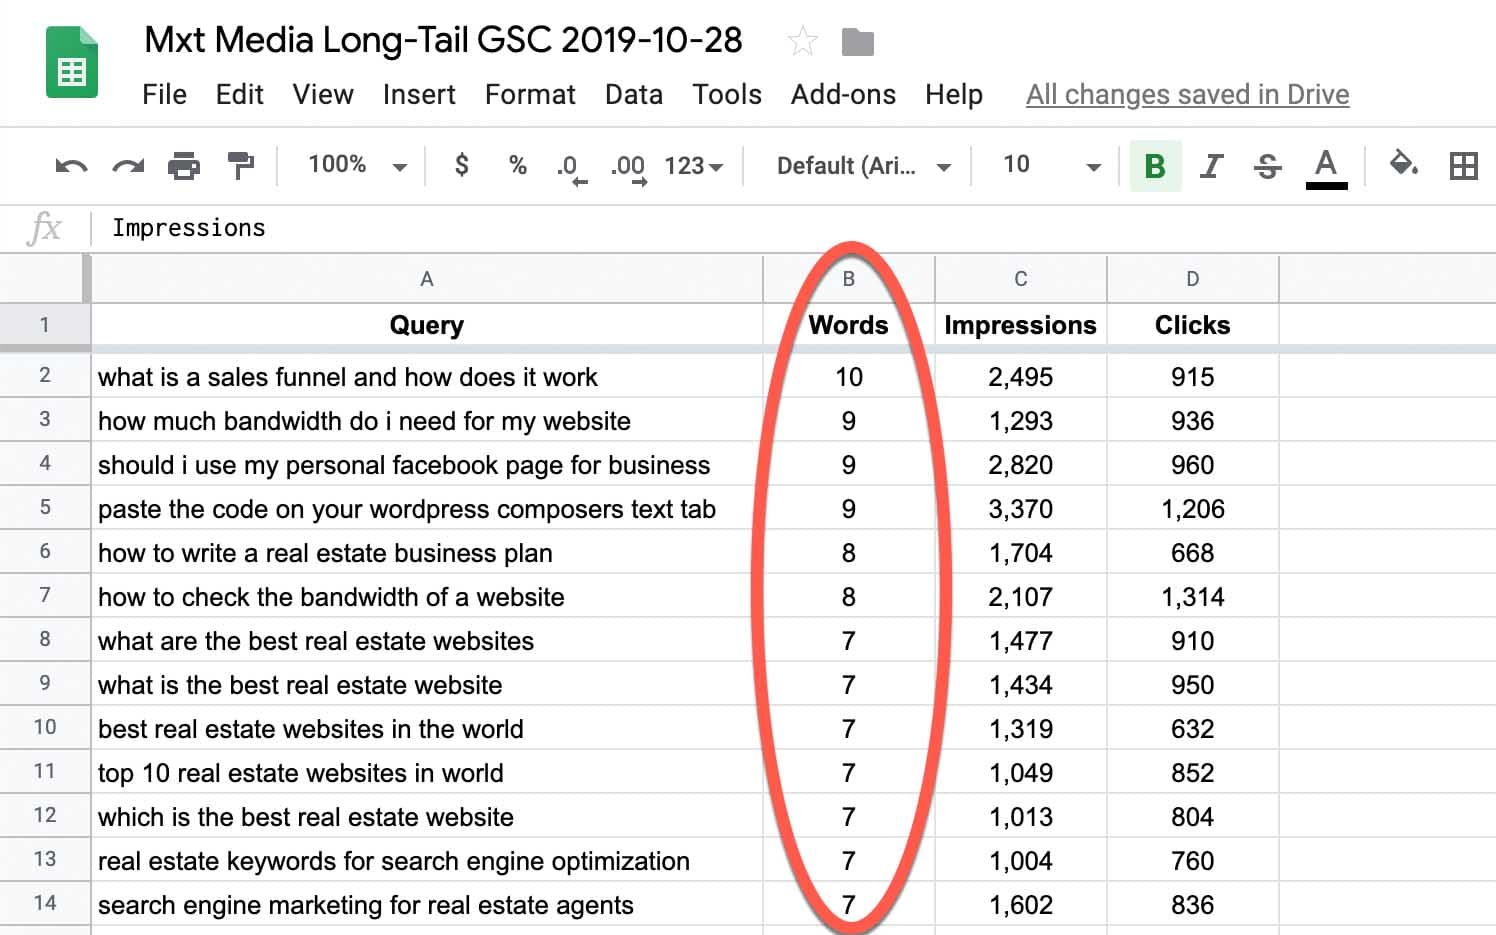
Sort by Impressions, then Length
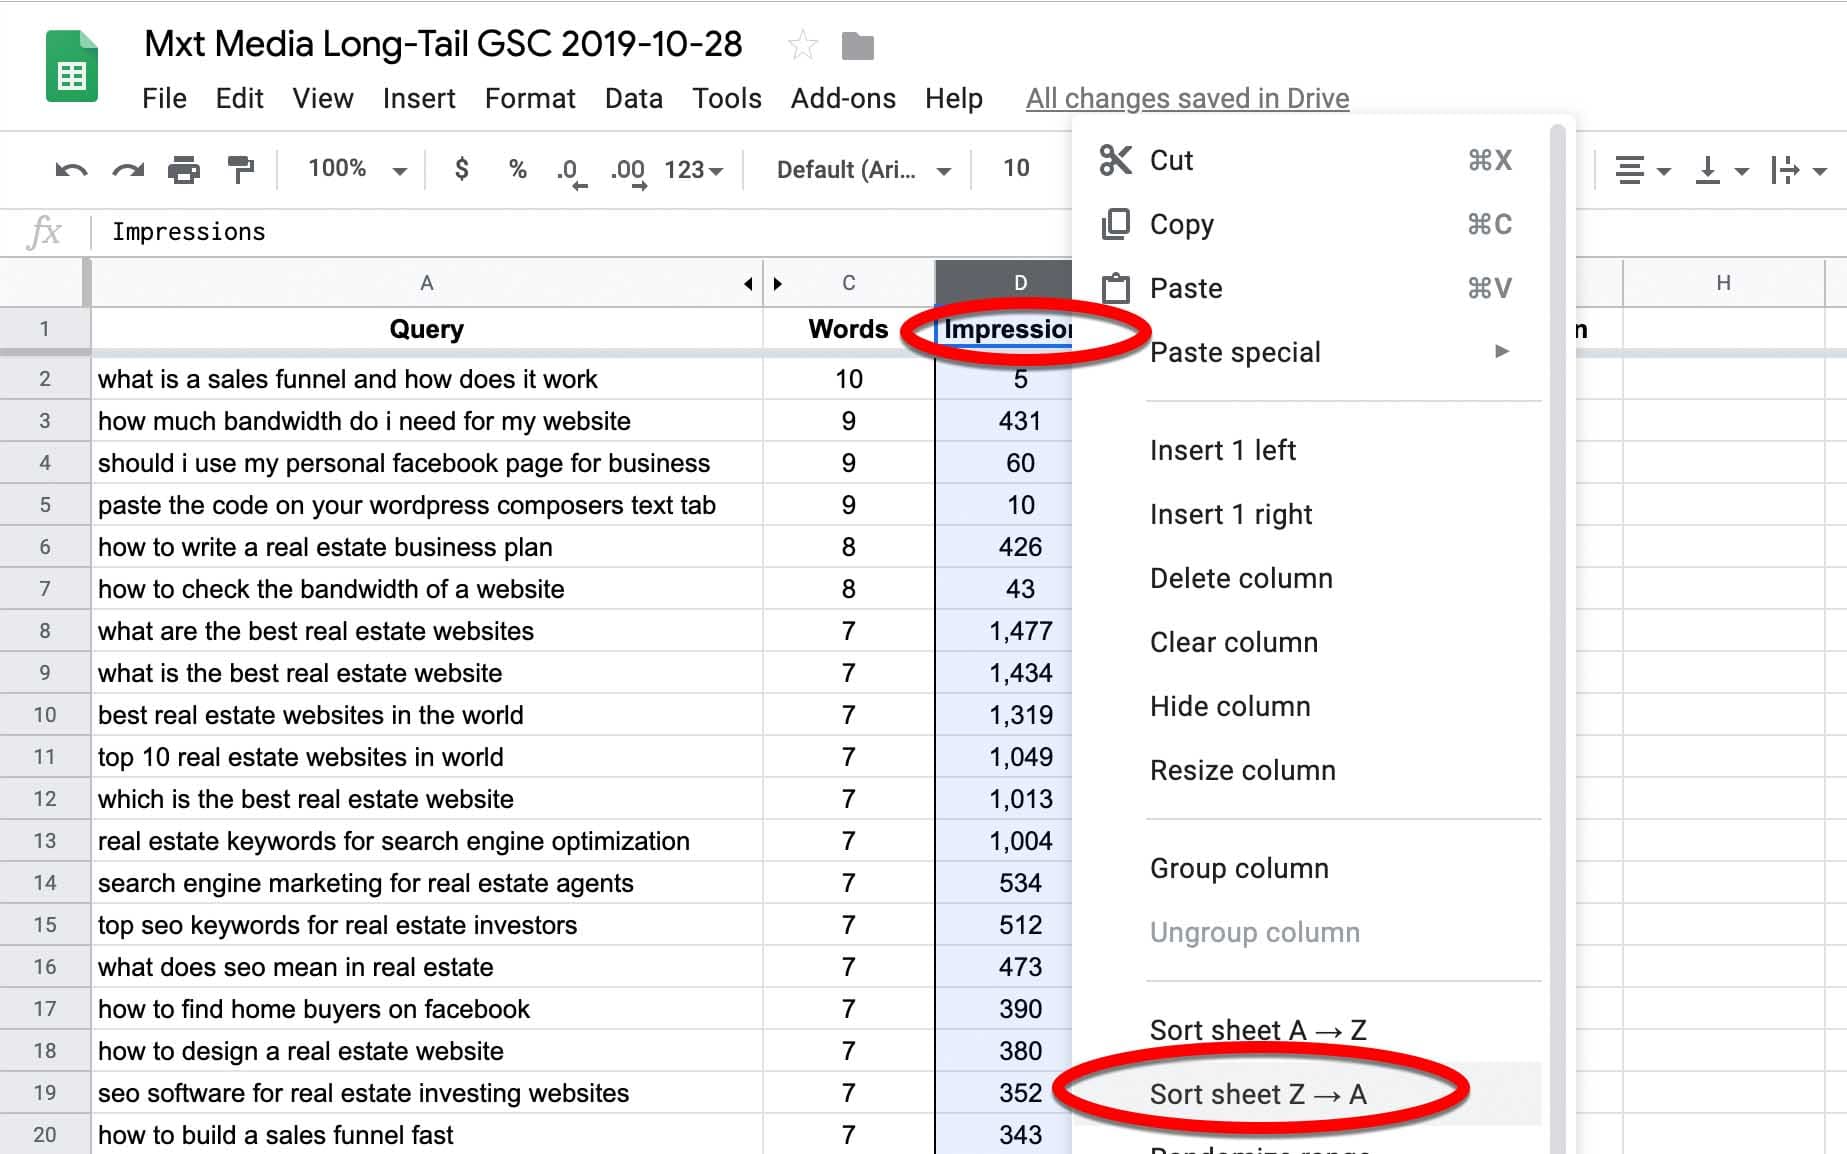
Sort your spreadsheet by Impressions Z-A first. This will arrange all the cells into most-visible-first order.
Then, sort again. This time, Length Z-A.
Now you’ve got a spreadsheet of the 1,000 phrases driving search Impressions (and hopefully traffic), sorted with long tail* phrases, highest visibility first.
3. Match to GA Traffic
This one is bonus. GSC provides Click and Average Position data, of course. So viewing these data in Google Analytics may not be necessary.
But if you want, you can hop over to GA and see the data over there, where the Users data is likely to be more reliable.
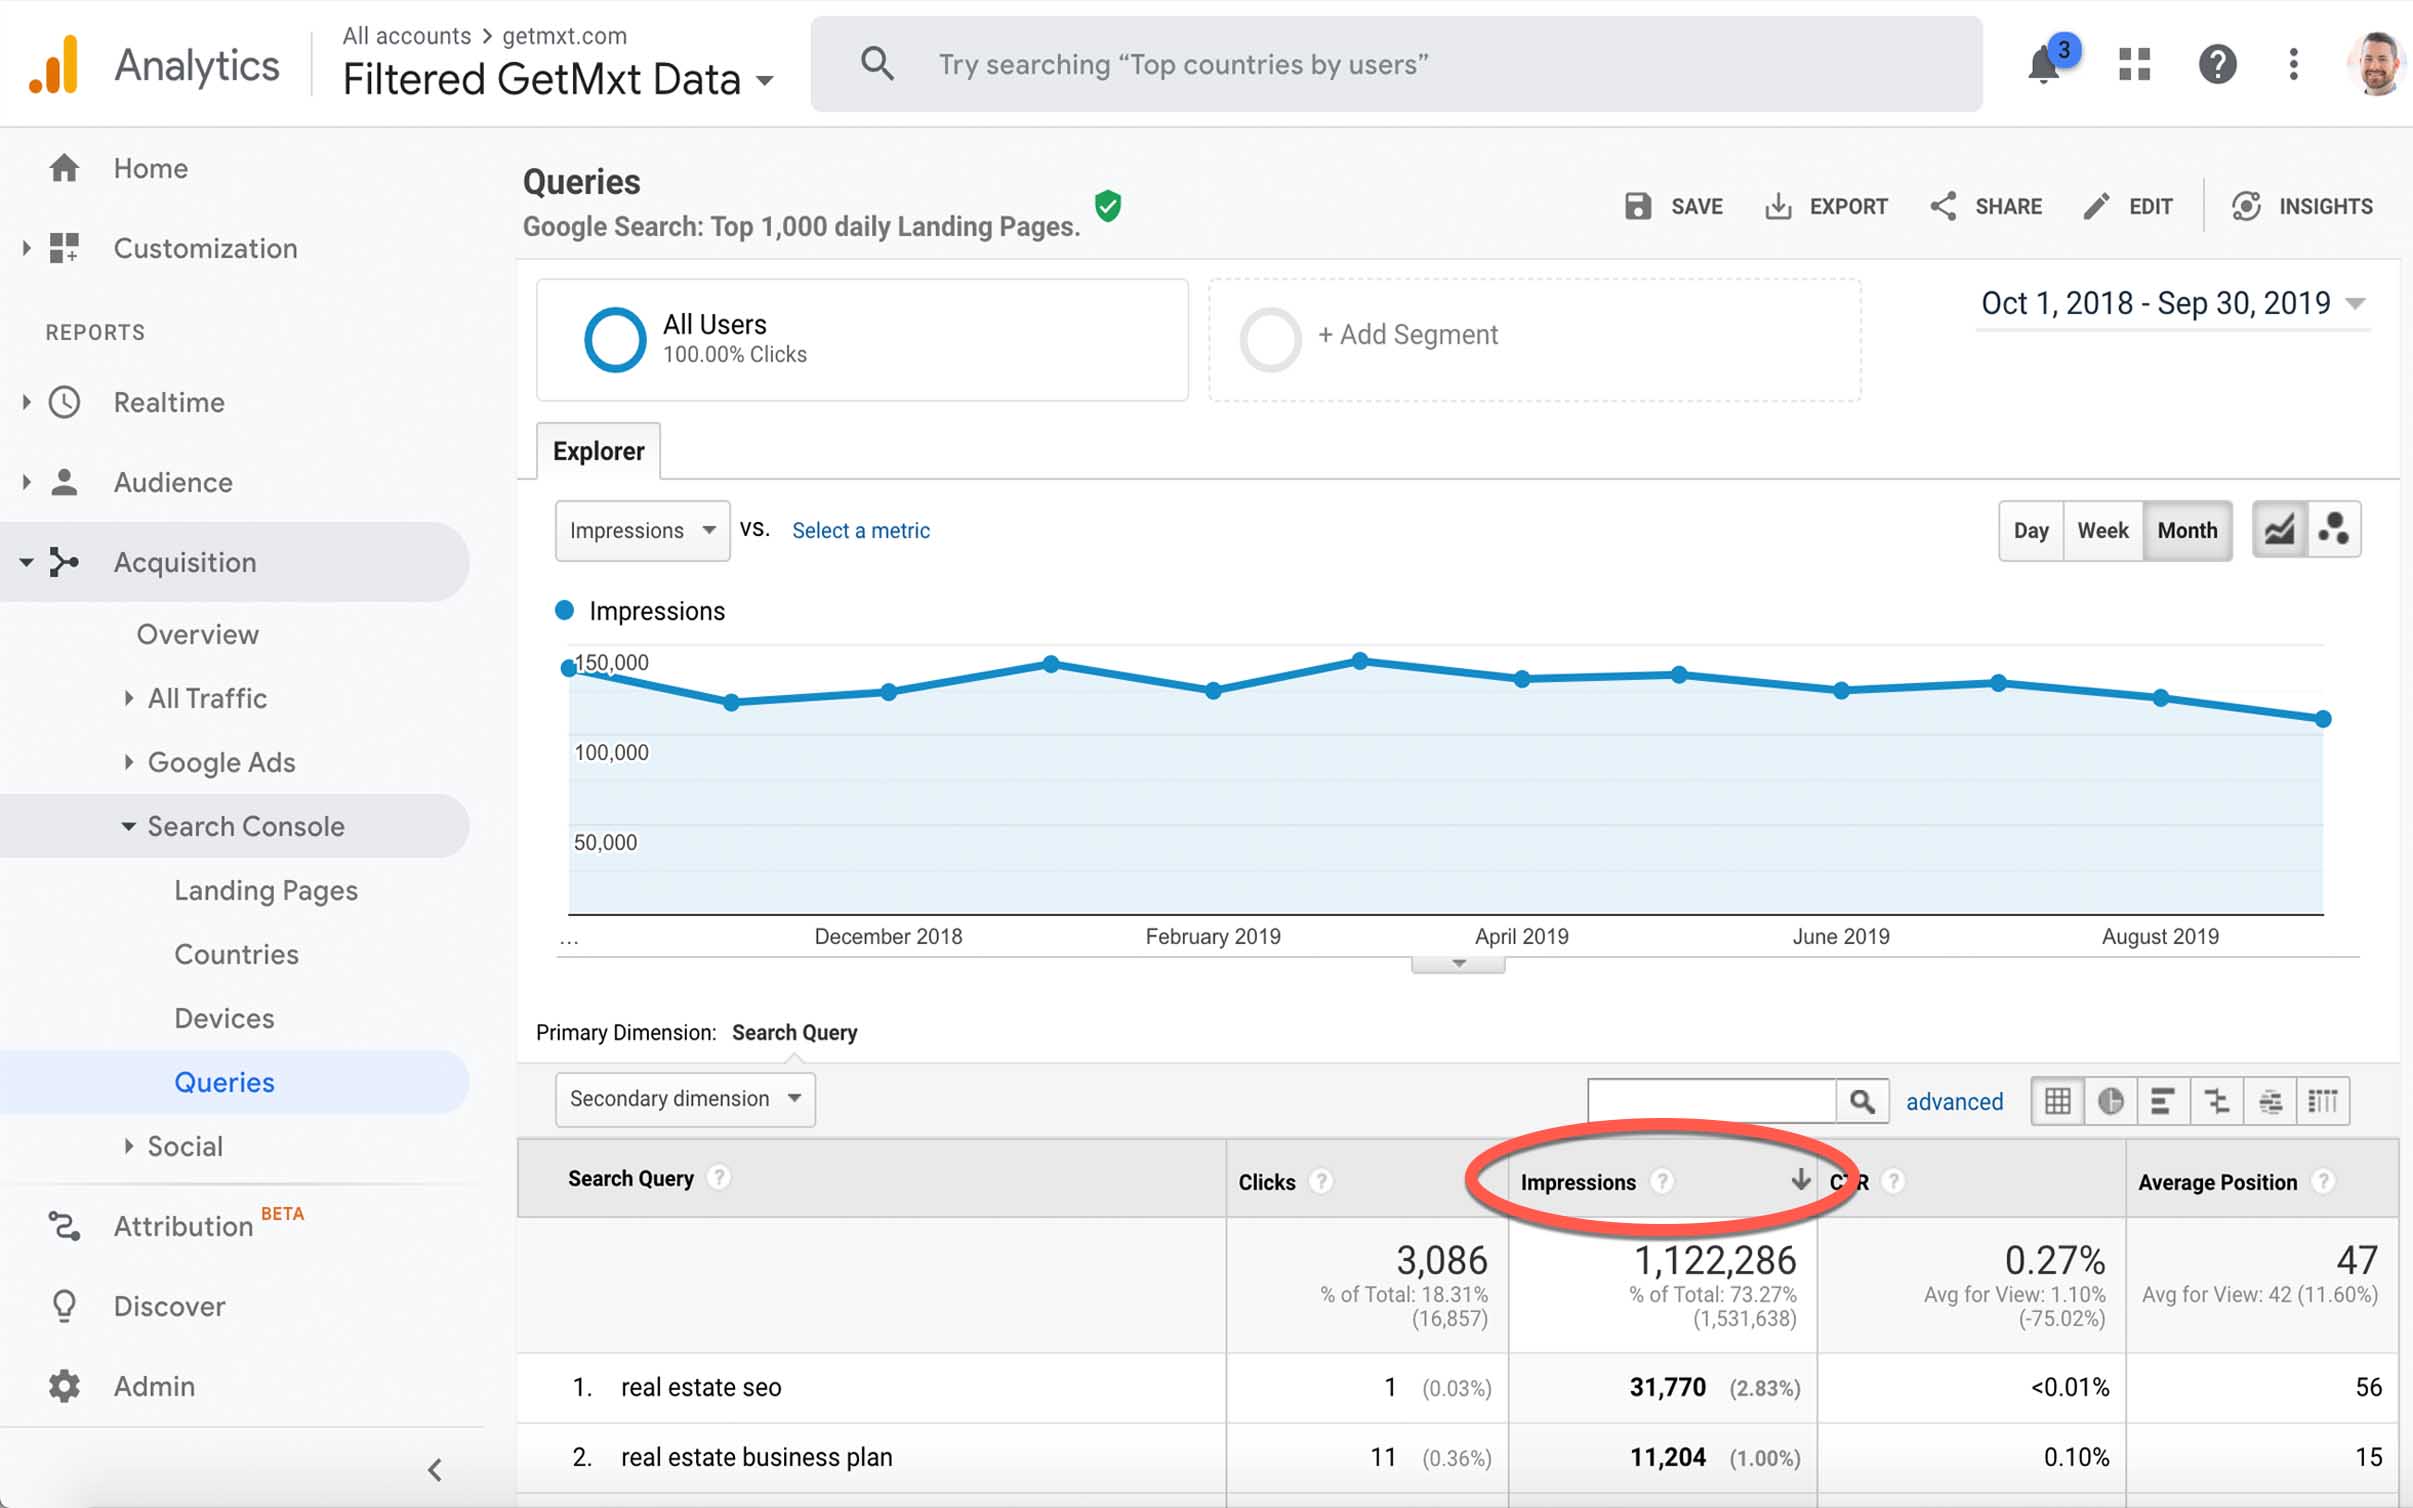
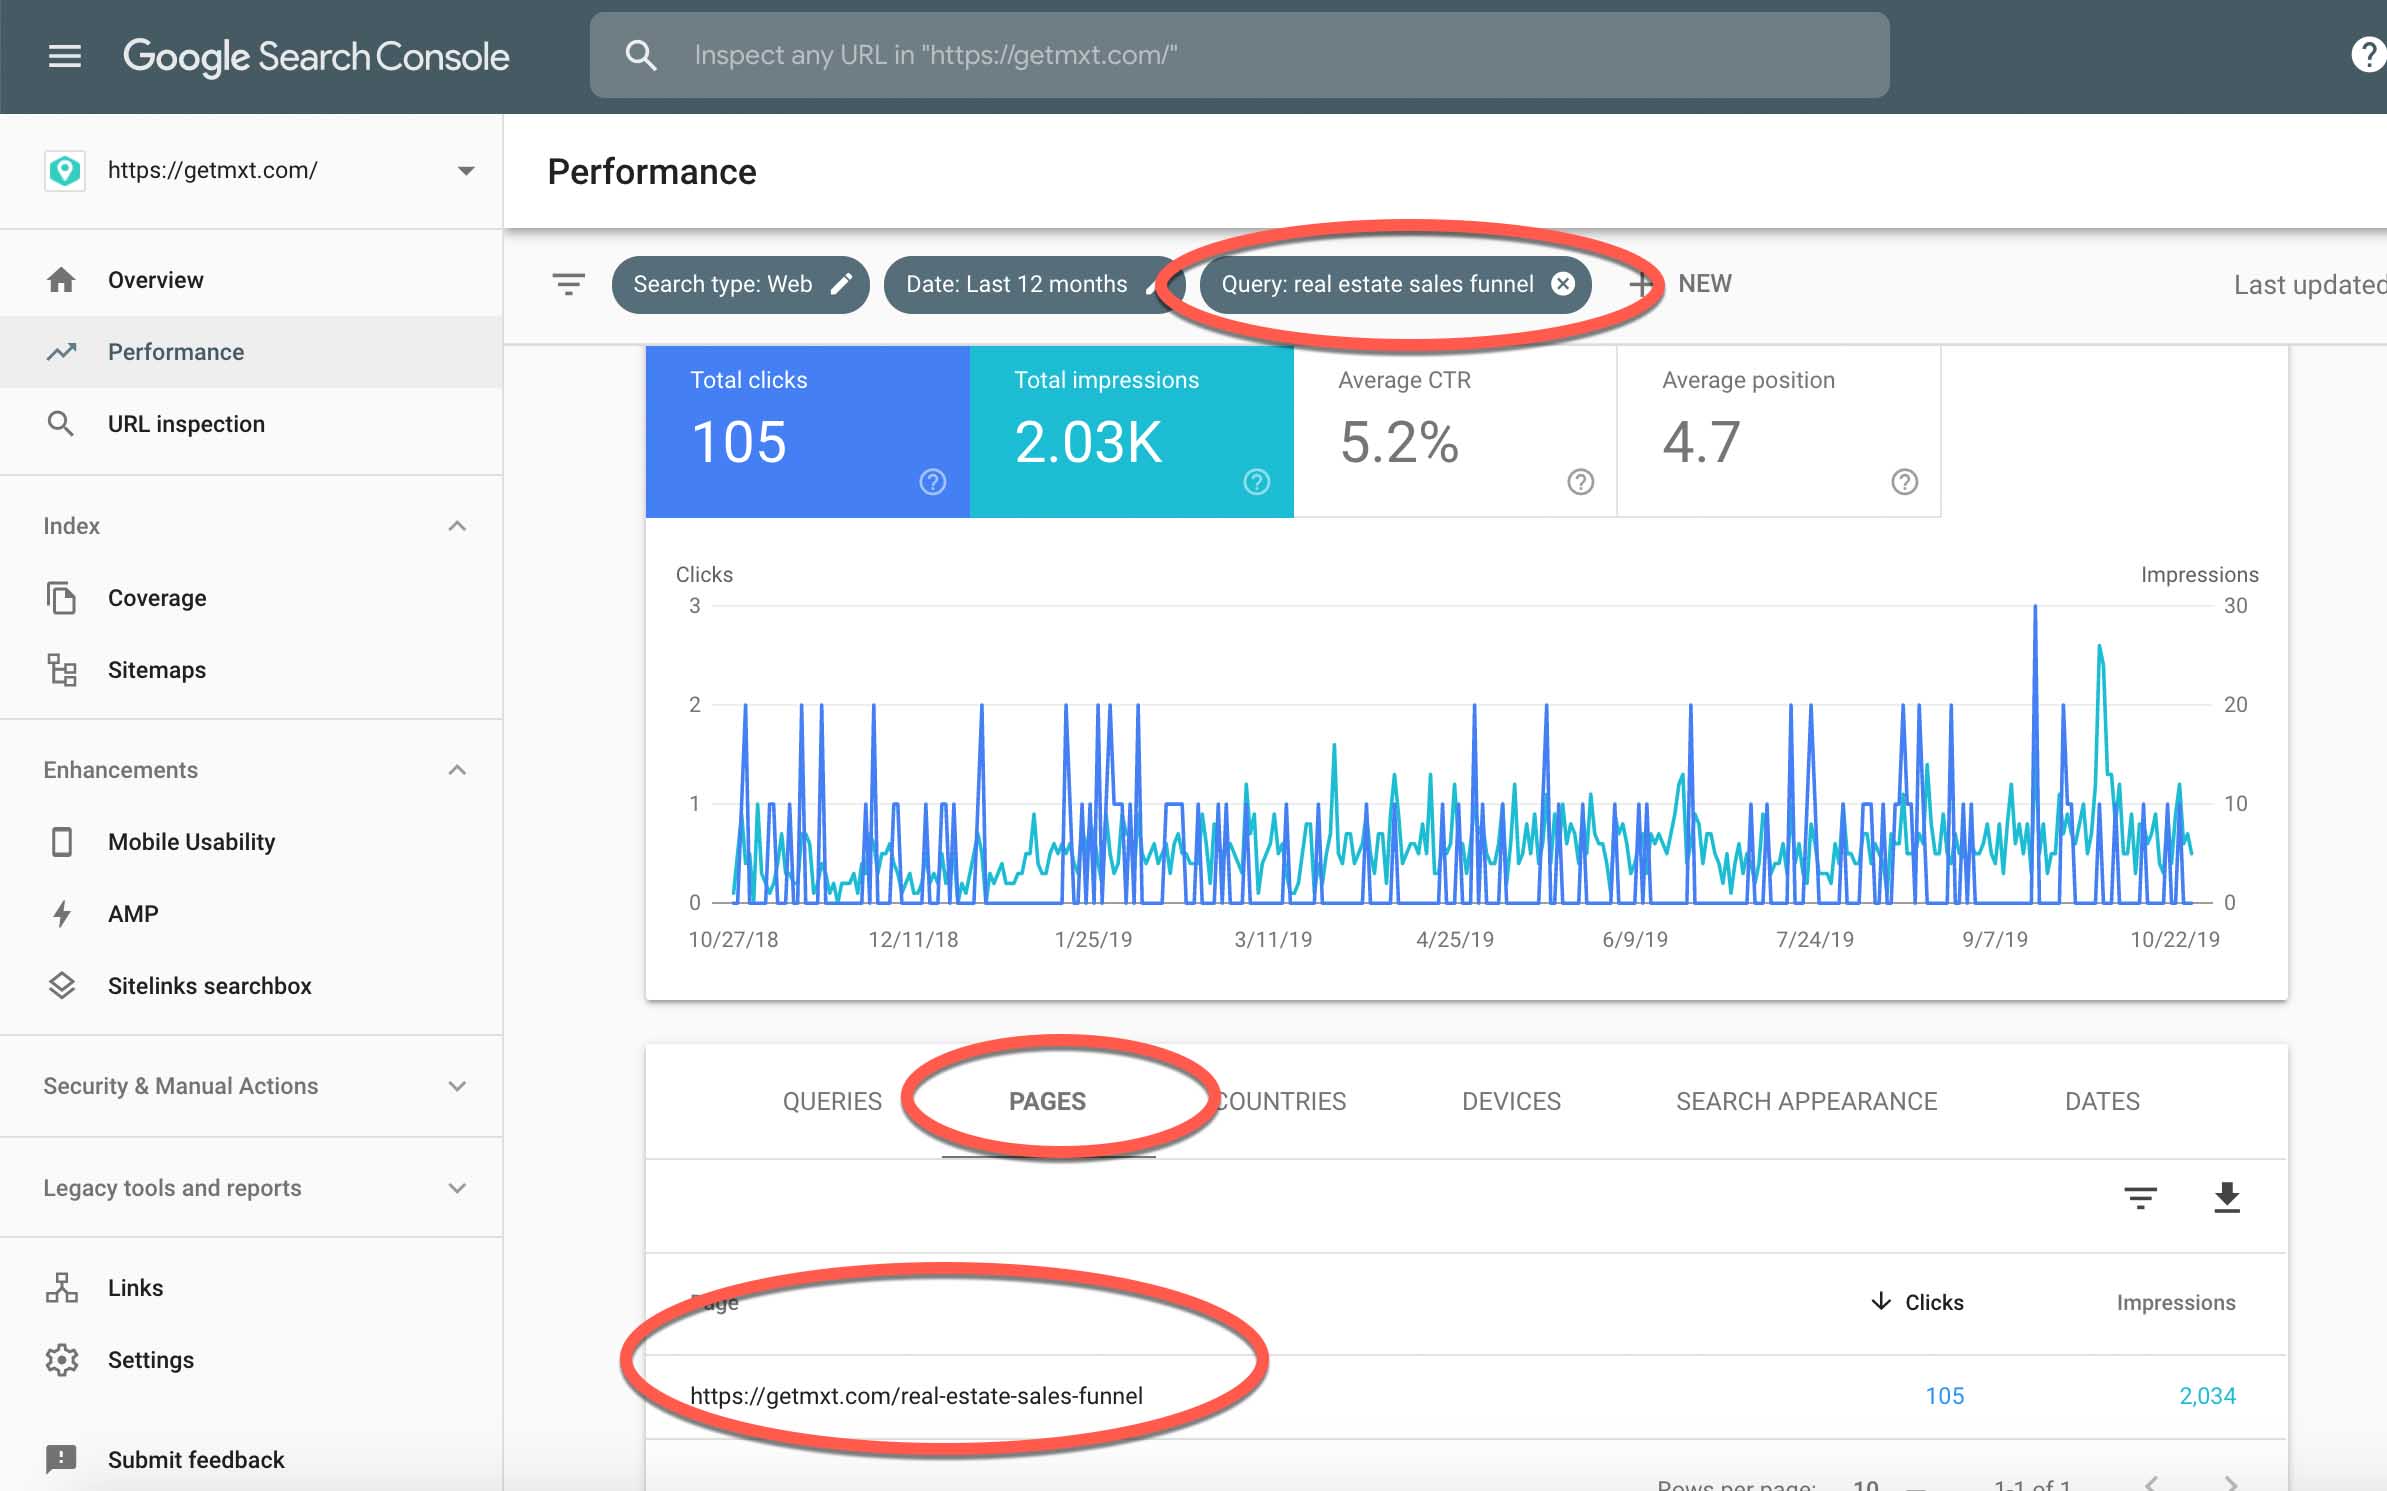
You could, if you had the time, click through every Query in Search Console—or, say, your top 10—and see which Pages are getting traffic.
It’s probably already intuitive to you, but there could be some surprises.
It kinda boggles my mind that you can’t combined these two views in GA—Queries as a Primary Dimension, and Landing Page as a Secondary Dimension.
That sort of data would be incredibly helpful for planning and even SEO outreach and link building.
But again— I digress.
Why bother with any of this? How does a long tail benchmark help?
Google claims you can’t optimize for BERT. But we can still learn from it. That’s where the benchmarking comes in.
Now that you have your list of long tail* queries, here’s what you should do with it.
Diagnose your vulnerability.
Now that you can see which long tail* terms are generating the most visibility and traffic for your websites, you can tell how vulnerable you are to the BERT-slap.
It’s possible that BERT will high-five you, and you’ll see your organic numbers climb.
But maybe not.
This guide will help you predict if your traffic will go up or down, based on how well your long tail queries actually match the intention and context of your pages.
 Document & annotate.
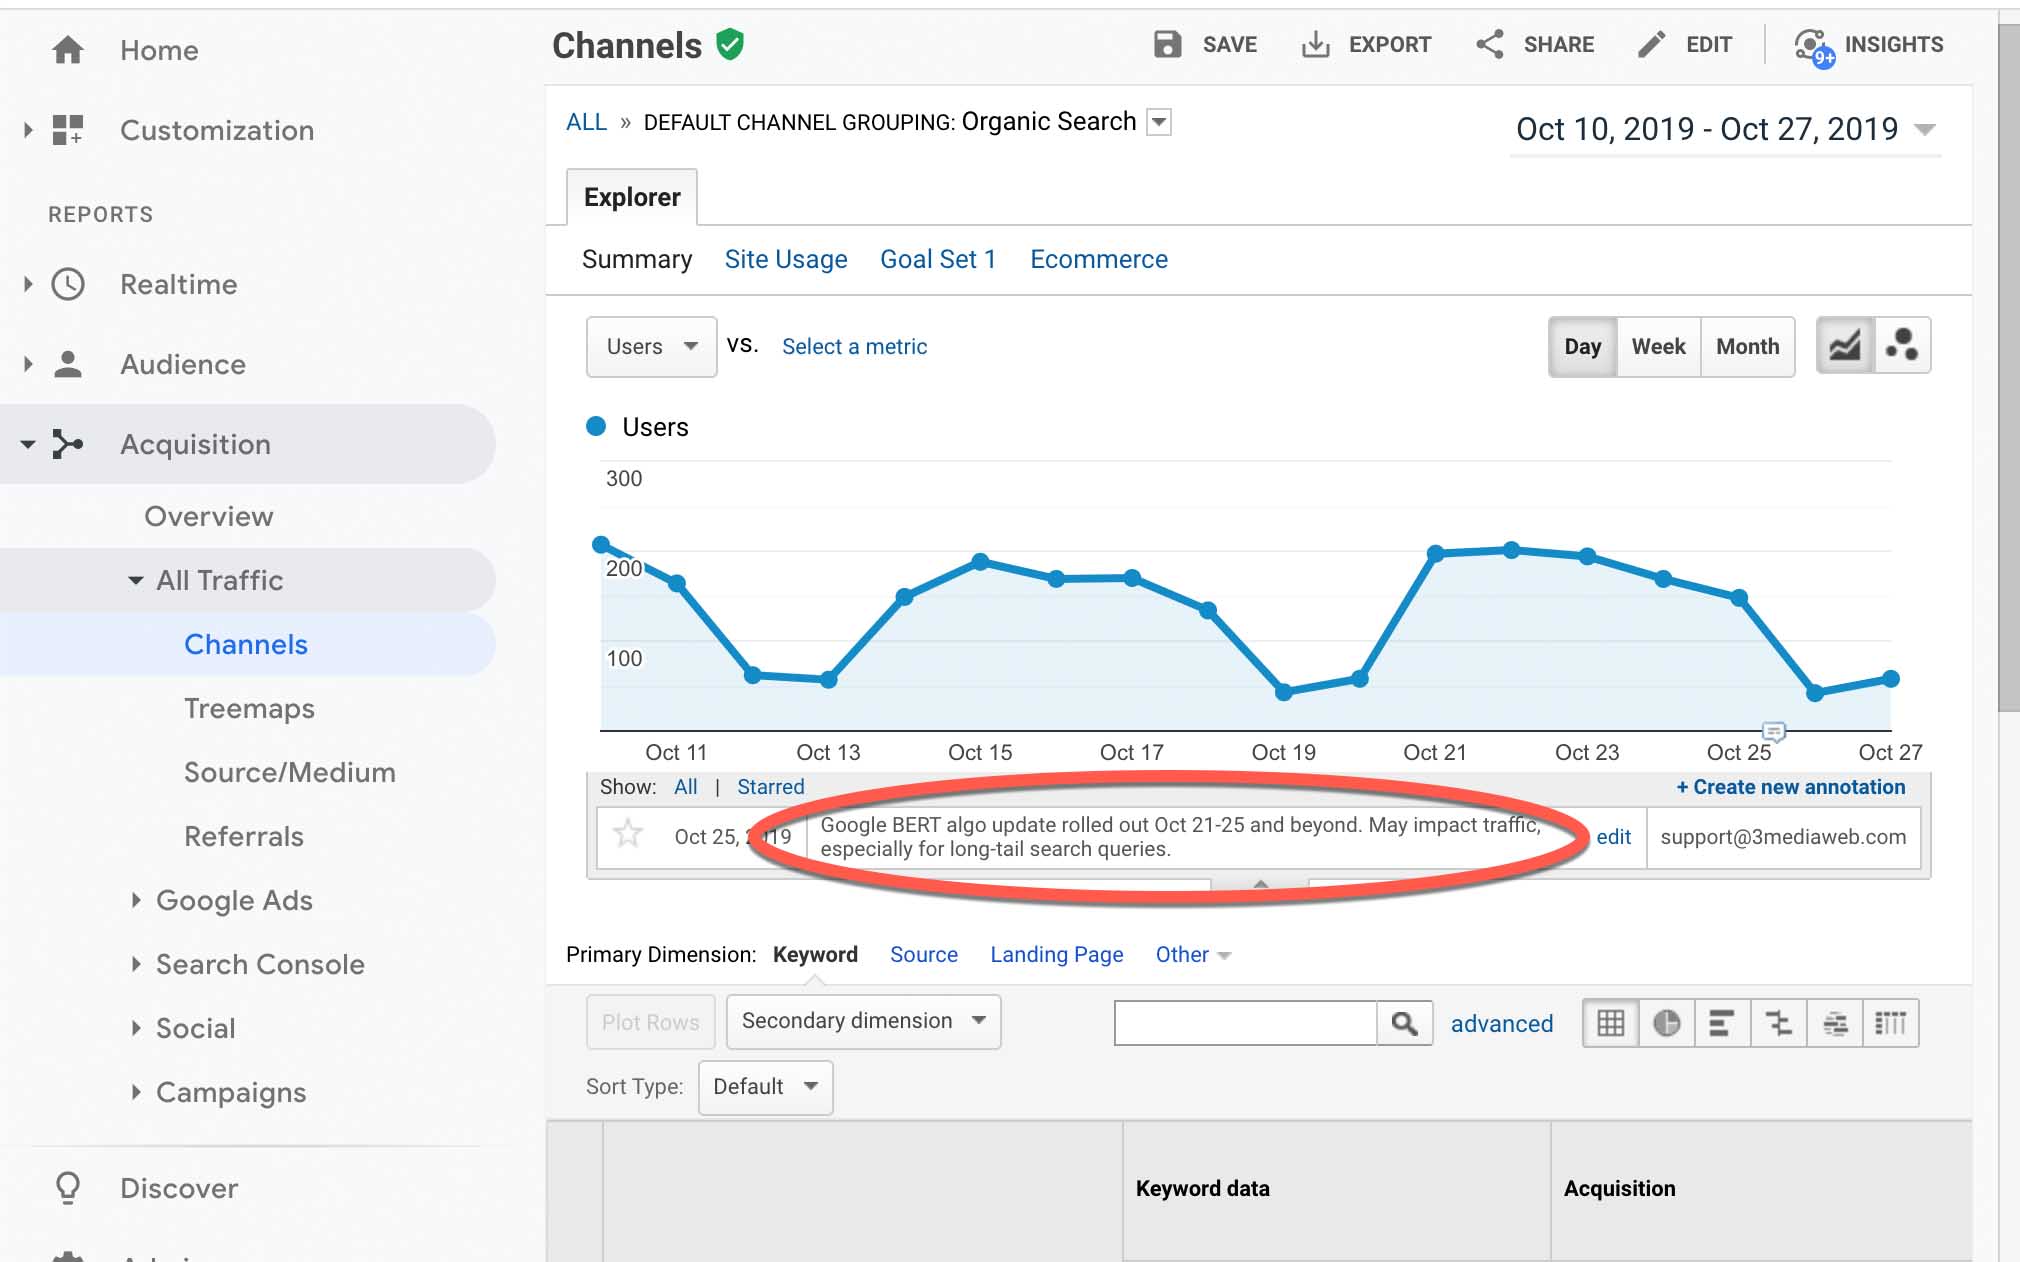
Add annotations in your Google Analytics accounts, especially for clients. And especially if you/they get lots of long tail traffic.
6 months from now, when you’re struggling to figure out why your numbers changed, look back at this documentation and compare against newer data.
Which leads me to my last point…
Benchmark again.
Benchmarks are observations. They’re meaningless without comparisons and context.
Wait a month, 3 months, 6 months, and a year, and then repeat these steps. Do the benchmarking again to see what changed.
Bonus points if you export narrow-scope GSC data (like one month at a time), and then you can isolate months, rather than aggregate monthly averages for your comparisons.